Introduction
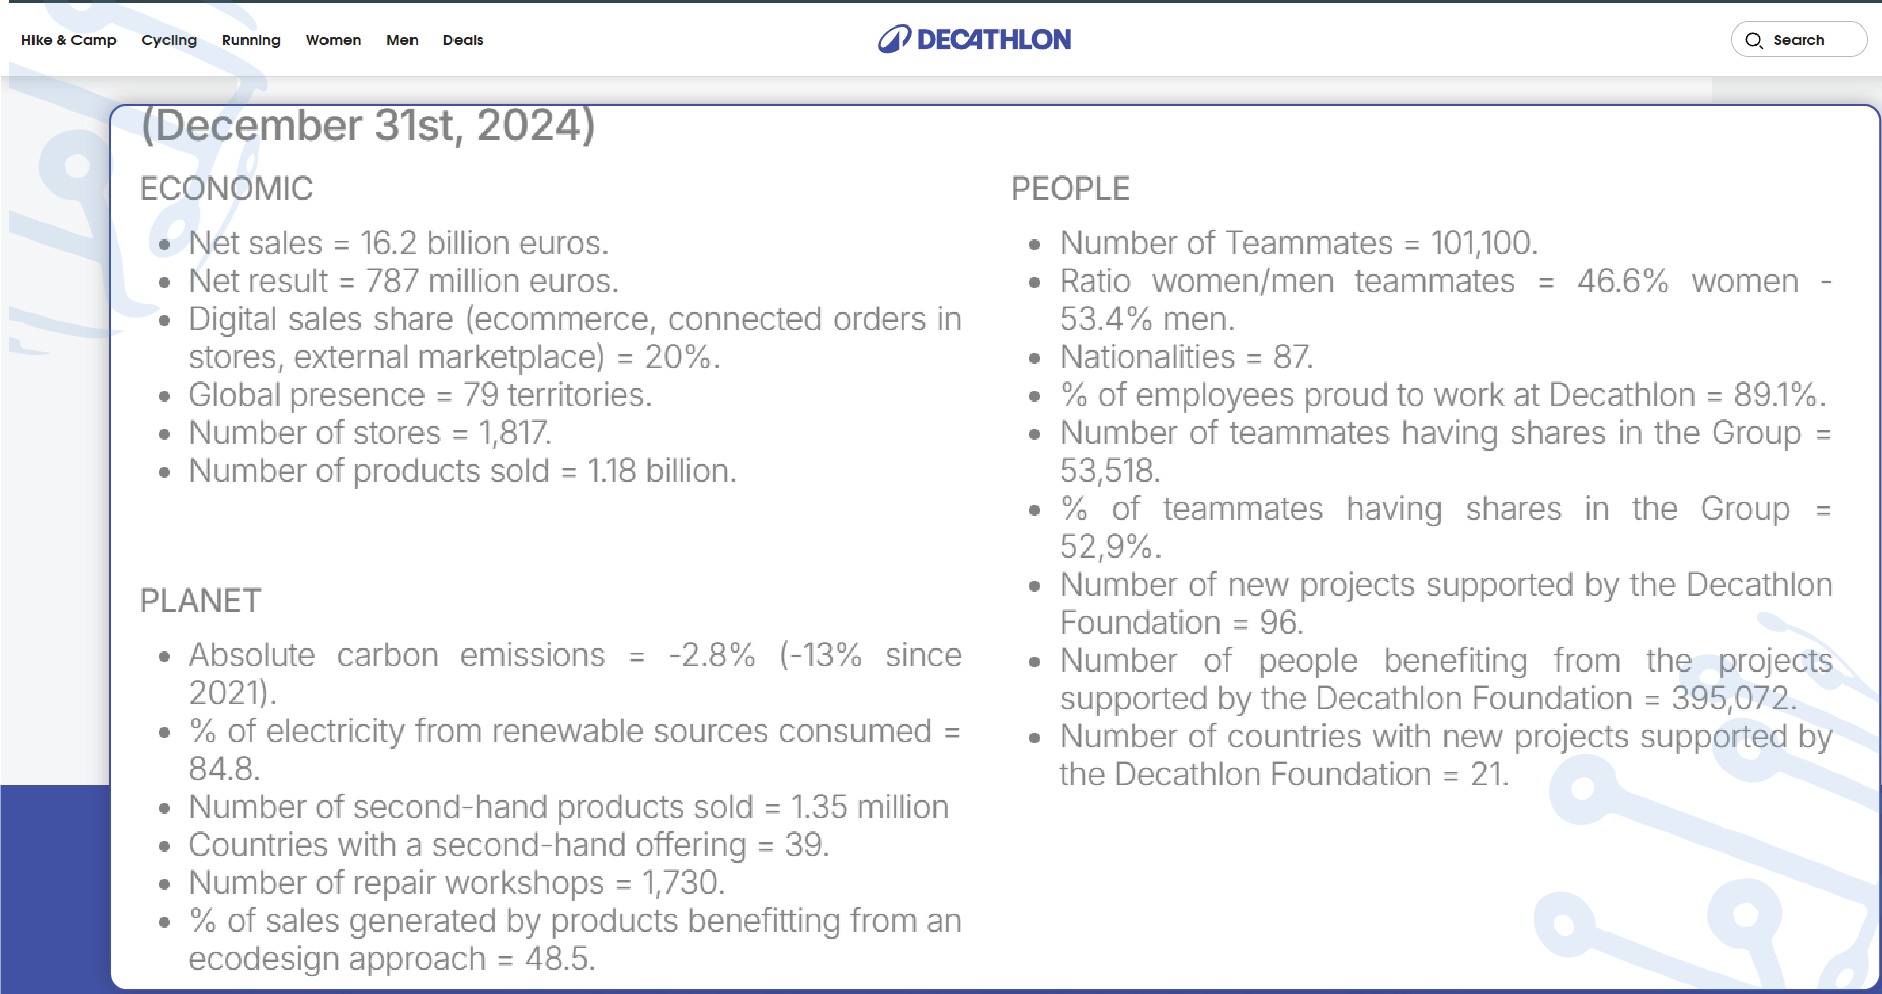
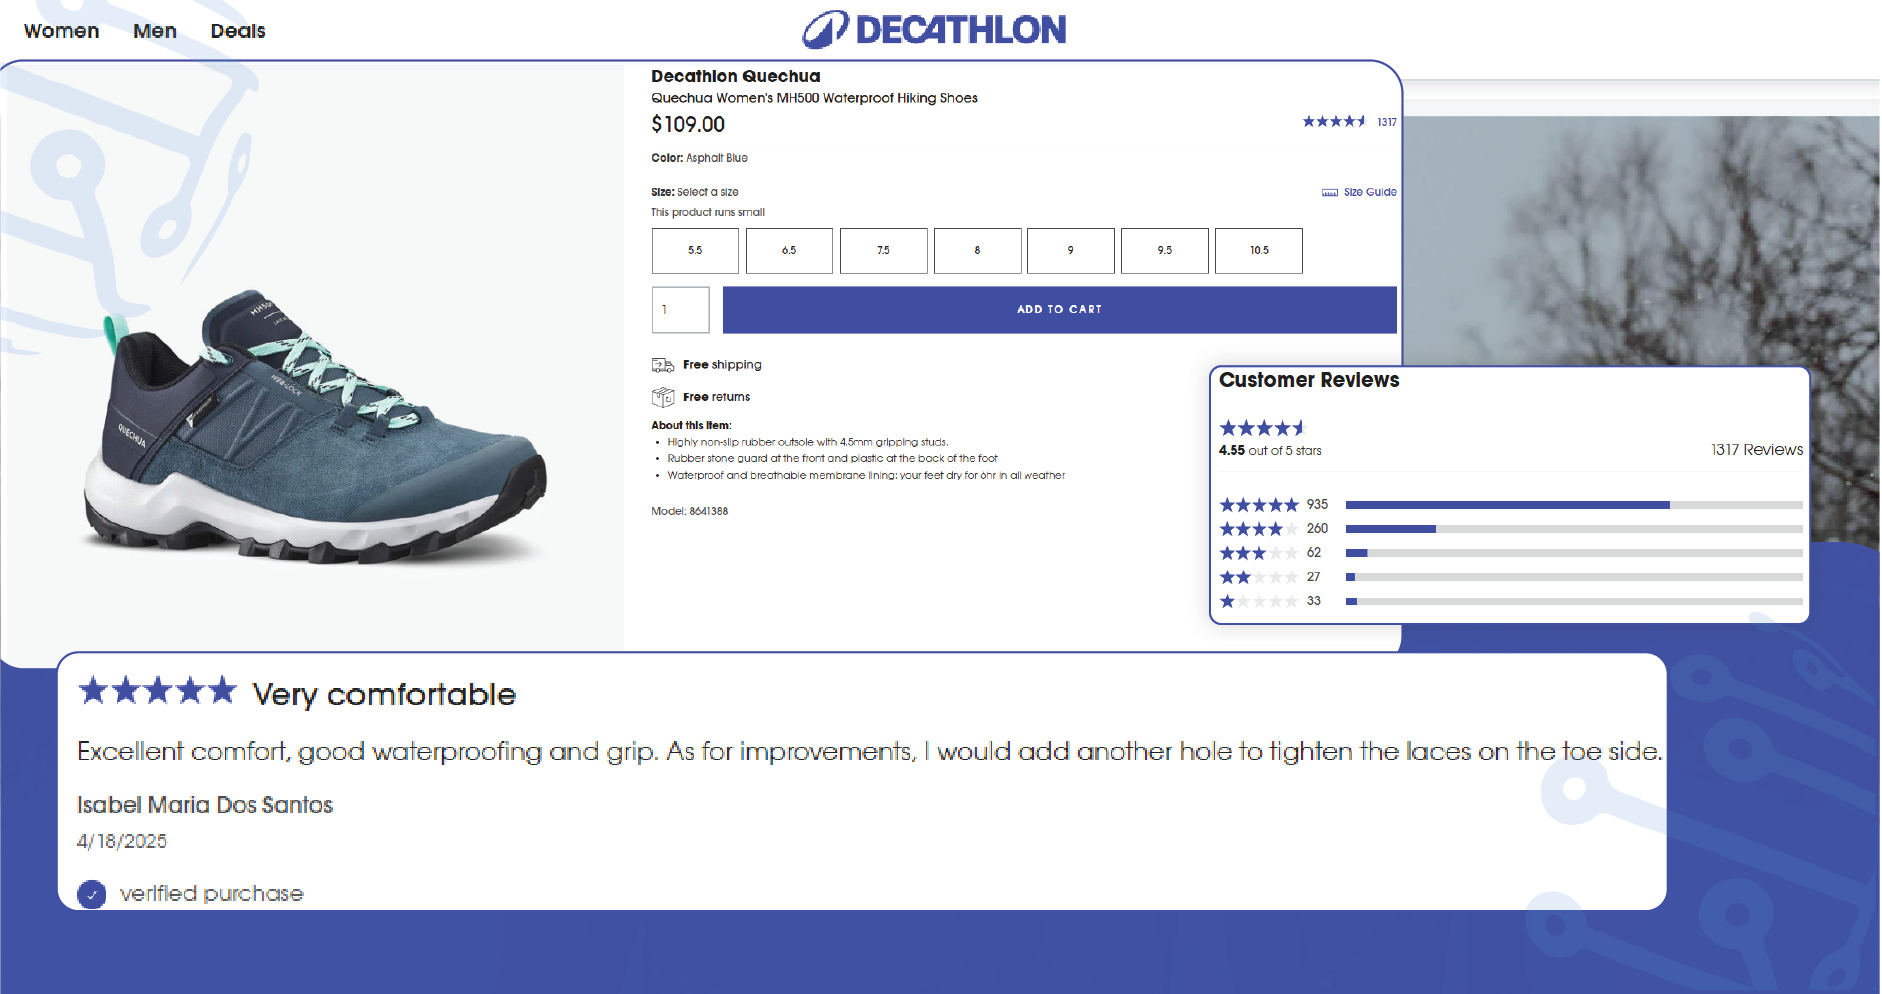
The sports and outdoor retail giant Decathlon continues to evolve in the e-commerce landscape, with 2024 marking a year of significant growth, expansion, and adaptation. Leveraging Decathlon Product Datasets through Web Scraping Decathlon Data, ArcTechnolabs provides an in-depth analysis of Decathlon’s sales trends, consumer behavior, and promotional strategies. By exploring E-Commerce Datasets and real-time Decathlon sales data scraping, businesses can identify patterns that shape the market and optimize their strategies. This report investigates key trends in Decathlon's pricing, product categories, promotional offers, and consumer preferences for 2024, providing actionable insights for investors, analysts, and retailers.
Market Trends in Decathlon Sales 2024

In 2024, Decathlon's online presence continued to surge, driven by the increasing demand for affordable sports gear and fitness equipment. Leveraging Web Scraping ECommerce Data, we can trace how product categories evolved and how pricing strategies adapted to market conditions.
Key Market Drivers & Stats
1. Online Shopping Surge
Online retail channels for Decathlon have consistently grown, with consumers opting for convenience, variety, and exclusive online offers.
| Year | Percentage of Total Sales from Online Channels | Increase YoY (%) |
|---|---|---|
| 2020 | 32% | — |
| 2021 | 39% | +21.8% |
| 2022 | 43% | +10.3% |
| 2023 | 47% | +9.3% |
| 2024 | 52% | +10.6% |
Insight: Over half of Decathlon’s revenue now originates from online sales, emphasizing the importance of digital-first strategies.
2. Rise of Health Consciousness
The pandemic has left a lasting impact on lifestyle habits, with increased investments in personal health and fitness leading to higher demand across key categories.
| Year | Home Fitness Equipment Sales (USD Millions) | Growth YoY (%) | Most Popular Item |
|---|---|---|---|
| 2020 | $1.1B | — | Resistance Bands |
| 2021 | $1.4B | +27.3% | Dumbbells |
| 2022 | $1.7B | +21.4% | Exercise Bikes |
| 2023 | $2.0B | +17.6% | Treadmills |
| 2024 | $2.5B | +25.0% | Multi-gyms |
Insight: Fitness equipment sales have doubled in four years, mirroring the long-term shift toward home-based workouts and wellness.
3. Discounting and Promotions
Using Web scraping Decathlon discount trends, we tracked discount frequency, seasonal sales periods, and pricing behavior across product categories.
| Year | Avg. Discount Applied (%) | Sales Uplift During Promotions (%) | Major Sale Events |
|---|---|---|---|
| 2020 | 12% | +18% | End of Season |
| 2021 | 14% | +22% | Fitness Week |
| 2022 | 15% | +24% | Summer Deals |
| 2023 | 16% | +27% | Black Friday |
| 2024 | 14% | +25% | Year-End Offers |
Insight: Promotions have become a core part of Decathlon’s strategy, with consistent returns in sales uplift during major campaigns.
With the help of Web Scraping Services and Web Scraping API Services, businesses can closely track these macro and micro trends across Decathlon's online platform. These Decathlon Product Datasets enable targeted decision-making, accurate demand forecasting, and pricing strategies tailored to real-world consumer behavior.
Consumer Insights and Behavior

Understanding consumer behavior is crucial in predicting how Decathlon's sales will progress in the coming years. With the help of the Decathlon Product Dataset and real-time Decathlon sales data scraping, we can break down consumer spending habits, top-selling categories, and shifting regional preferences that impact E-Commerce Datasets and long-term strategies.
1. Sports Apparel Trends (2020–2024)
| Year | Revenue from Sports Apparel (USD Millions) | Growth YoY (%) | Popular Items |
|---|---|---|---|
| 2020 | $1.8B | — | Moisture-wick T-shirts |
| 2021 | $2.1B | +16.7% | Yoga Pants, Running Shorts |
| 2022 | $2.4B | +14.3% | Compression Wear |
| 2023 | $2.9B | +20.8% | Thermal Jackets |
| 2024 | $3.5B | +20.7% | Eco-friendly Apparel |
Insight: A consistent upward trajectory is observed in sports apparel, indicating rising demand for both function and fashion across user segments.
2. Fitness Equipment Sales
| Year | Revenue from Fitness Equipment (USD Millions) | Growth YoY (%) | Trending Equipment |
|---|---|---|---|
| 2020 | $1.1B | — | Resistance Bands |
| 2021 | $1.4B | +27.3% | Dumbbells, Foam Rollers |
| 2022 | $1.7B | +21.4% | Benches, Jump Ropes |
| 2023 | $2.0B | +17.6% | Rowing Machines |
| 2024 | $2.5B | +25.0% | Multi-Gyms, Smart Equipment |
Insight: Fitness equipment demand reflects the persistent impact of remote work and personalized health routines on consumer priorities.
| Year | Revenue from Outdoor Gear (USD Millions) | Growth YoY (%) | Key Product Segments |
|---|---|---|---|
| 2020 | $0.9B | — | Tents, Sleeping Bags |
| 2021 | $1.2B | +33.3% | Hiking Shoes, Backpacks |
| 2022 | $1.4B | +16.7% | Bicycles, Trekking Poles |
| 2023 | $1.8B | +28.6% | Hammocks, Bike Gear |
| 2024 | $2.3B | +27.8% | E-Bikes, Modular Tents |
Insight: The return to nature post-pandemic has fueled a surge in outdoor gear sales, especially in categories tied to sustainability and adventure tourism.
4. Regional Preference Breakdown – 2024 Snapshot
| Region | Top Category | % Share in Sales | Consumer Insight |
|---|---|---|---|
| North America | Fitness Equipment | 34% | Strong gym culture, remote fitness setups |
| Europe | Sports Apparel | 38% | Eco-conscious wear, urban activewear |
| Asia-Pacific | Outdoor Gear | 41% | Interest in outdoor sports, biking, and hiking |
| Middle East | Sports Apparel | 29% | Stylish performance gear |
| South America | Fitness Equipment | 32% | Home fitness trend post-lockdowns |
Insight: Regional data shows a tailored product demand landscape, which is essential for optimizing inventory using Web Scraping Services, Mobile App Scraping Services, and Web Scraping API Services.
These consumer insights reveal how evolving preferences, cultural trends, and post-pandemic behaviors influence Decathlon’s growth strategies and product innovation across global markets.
Sales Data Analysis (2020–2024)
-01.webp)
Using Decathlon 2024 Sales Data Analysis, the report examines Decathlon’s sales performance over the past five years, including year-on-year growth, key product launches, and seasonal spikes.
Decathlon Sales Performance: 2020–2024
| Year | Sales Revenue (USD) | Growth (%) | Top Performing Categories | Discount Strategy Impact (%) |
|---|---|---|---|---|
| 2020 | $10.4 billion | +15.2% | Sports Apparel, Fitness Equipment | 12% |
| 2021 | $12.2 billion | +17.3% | Outdoor Gear, Cycling | 18% |
| 2022 | $13.5 billion | +10.6% | Fitness Equipment, Camping Gear | 15% |
| 2023 | $14.1 billion | +5.8% | Sports Apparel, Running Shoes | 16% |
| 2024 | $15.0 billion | +6.4% | Outdoor Gear, Fitness Apparel | 14% |
Insight: Decathlon’s sales growth has consistently outpaced the global retail industry, driven by an increase in consumer spending on sports-related products and a focus on high-quality, affordable goods.
Promotional Strategies and Pricing Analysis

One of the driving factors behind Decathlon's 2024 success is their savvy promotional strategies, including Decathlon promotional data extraction through Web Scraping Decathlon Data . Decathlon’s ability to execute sales data scraping across different platforms and analyze the effectiveness of promotions plays a pivotal role in maintaining its competitive edge.
Key Promotional Campaigns:
- Seasonal Sales – Major sales events like “Summer Sports Sale” and “Winter Fitness Sale” lead to increased conversions.
- Flash Sales – Time-limited discounts and promotions (especially for new product releases) drive urgency among consumers.
Promotions Impact (2020-2024)
| Year | Flash Sales (%) | Seasonal Promotions Impact (%) | Average Discount (%) | Sales Volume Increase (%) |
|---|---|---|---|---|
| 2020 | 30% | 22% | 14% | 19% |
| 2021 | 28% | 25% | 16% | 20% |
| 2022 | 32% | 18% | 18% | 21% |
| 2023 | 34% | 20% | 17% | 23% |
| 2024 | 30% | 22% | 14% | 25% |
Technology and Data Scraping for Market Insights
In today’s fast-paced retail environment, real-time Decathlon sales data scraping is crucial for staying ahead of the competition. By integrating Decathlon sales data scraping API, ArcTechnolabs empowers businesses and analysts with structured, up-to-date data — reducing manual collection time and supercharging data-driven decisions.
With robust Web Scraping Services and Mobile App Scraping Services , ArcTechnolabs delivers scalable, automated pipelines for extracting insights from Decathlon’s online platforms. This enables real-time market forecasting, pricing intelligence, product demand analysis, and competitor monitoring.
1. Adoption of Sales Data APIs (2020–2024)
| Year | Companies Using Sales APIs | % Increase YoY | Avg. Data Points Accessed/Day |
|---|---|---|---|
| 2020 | 420 | — | 8,000 |
| 2021 | 590 | +40.5% | 11,500 |
| 2022 | 780 | +32.2% | 14,800 |
| 2023 | 1,020 | +30.8% | 18,300 |
| 2024 | 1,360 | +33.3% | 23,000 |
Insight: The rising number of companies leveraging Decathlon sales data scraping API signals its growing importance in competitive intelligence workflows.
2. Manual vs Automated Data Collection Impact
| Year | Avg. Time Saved/Week (Hours) | Manual Cost/Month (USD) | Automated Cost/Month (USD) | Productivity Gain (%) |
|---|---|---|---|---|
| 2020 | 9 | $2,100 | $890 | 45% |
| 2021 | 12 | $2,300 | $950 | 52% |
| 2022 | 15 | $2,600 | $980 | 59% |
| 2023 | 18 | $2,800 | $1,020 | 64% |
| 2024 | 22 | $3,100 | $1,050 | 68% |
Insight: Automated Web Scraping Services consistently reduce operational costs and save teams nearly 22 hours per week by 2024.
3. Real-Time Data Use Cases by Industry Sector (2024)
| Sector | Use Case | % Usage of Scraped Decathlon Data |
|---|---|---|
| Retail Analytics | Competitive pricing & stock trends | 38% |
| Sports Brands | Consumer demand forecasting | 27% |
| E-Commerce | Dynamic pricing & product bundling | 21% |
| Investment Firms | Market behavior & portfolio strategy | 14% |
Insight: Diverse sectors benefit from Web Scraping ECommerce Data , especially for pricing intelligence and consumer behavior forecasting.
These trends and figures confirm that real-time Decathlon sales data scraping, combined with scalable APIs and tailored services from ArcTechnolabs, is now a foundational layer for smart retail strategy and growth.
2024 has proven to be another successful year for Decathlon, marked by strong sales growth, strategic discounts, and the continuous evolution of its product offerings. By leveraging Decathlon Product Datasets and E-Commerce Datasets, businesses can tap into the wealth of data that Decathlon generates and refine their strategies for success in the evolving retail landscape. The data insights presented in this report are a testament to the power of Web Scraping Decathlon Data and how it can drive smarter, more profitable decision-making.
Take the next step in optimizing your sales and marketing strategies. Contact ArcTechnolabs today to learn more about our scraping services and how we can help you stay ahead of market trends.


